
Materials and Methods
The milk samples were protected from light by wrapping tubes and flasks with aluminum foil. Before being analyzed for the vitamin content, the milk samples were processed according to the method described by Albalá-Hurtado and co-workers [1]. The vitamin extraction procedure from DM samples was performed in a darkened room. Briefly, to 5 ml of sample, 0.5 g of TCA was added, and the mixture was stirred for 10 min over a magnetic stirring plate. Subsequently, the mixture was centrifuged for 10 min at 1250 g, and the first supernatant was recovered. To the precipitate, 3 mL of 4% TCA was added, mixed for 10 min, and then centrifuged again (same conditions as above). After centrifugation, the supernatant was recovered and combined with the first supernatant. These two acid extracts were brought to 10 mL with 4% TCA and filtered through a 0.45 mm filter (Whatman, Maidstone, UK), before being subjected to the RP-HPLC analysis.
The chromatographic courses were performed according to Albalá-Hurtado and co-workers [1], using an HPLC Agilent 1260 Infinity LC System (Agilent Technologies), consisting of a 1260 Infinity Quaternary Pump, 1260 Infinity Multisampler, 1260 Infinity Multicolumn Thermostat, and 1260 Infinity Diode Array Detector. Data were acquired by the OpenLab Software (Agilent technologies). The column was a C18 HiQSil HS, 5 mm, 4.6 mm i.d, 250 mm (Kya Tech Corporation, Tokyo, Japan). The mobile phase was: methanol (85:15), containing 0.5% triethylamine, 2.4% glacial acetic acid, and 5 mM octane sulfonic acid (pH 3.6). The analyses were carried out isocratically at 25 °C, with a flow rate of 0.9 mL/min; the total run was 40 min. The injection volume was 100 mL. The eluent was detected at 254 and 270 nm.
Standard solutions of vitamin B1 (0.1; 0.3; 0.5; 0.75; 1.5; 2.0; 3.1; 6.2; 9.3; 15.5; 18.7 mM), vitamin B2 (0.5; 0.75; 1.0; 1.5; 2.0; 5.0; 7.5; 10; 15 mM), nicotinamide (0.3; 0.5; 0.75; 1.0; 1.5; 2.0; 3.0; 5.0; 7.5 mM), nicotinic acid (0.75; 1.0; 2.0; 3.0; 5.0; 7.5; 10.0; 15.0; 20.0 mM), vitamin B6 (0.75; 1.0; 2.0; 3.0; 5.0; 7.5; 10.0; 15.0; 20.0 mM) and folic acid (0.3; 0.5; 0.75; 1.0; 1.5; 2.0; 3.0; 5.0; 7.5 mM) were prepared in ultra-pure water. A 100 mL solution of each standard was separately loaded on the RP-HPLC column. The area of each standard peak was measured using the valley-to-valley integration mode, and quantification was achieved by a calibration curve obtained relating the concentration (mM) of each standard loaded in the column to the respective peak area. The quantity of vitamin B1, B2, nicotinamide, nicotinic acid, vitamin B6, folic acid in milk samples was determined using the calibration curve.
Vitamin C content determination was performed using the kit L-Ascorbic Acid colorimetric method (Boehringer Mannheim) in which is exploited the ability of L-ascorbic acid to reduce the tetrazolium salt MTT [3-(4,5dimethylthiazolyl-2)- 2,5-diphenyltetrazolium bromide] in the presence of the electron carrier PMS (5- methylphenazinium methosulfate) at acidic pH to a formazan. The MTT-formazan is determined by means of its light absorbance in the visible range at 578 nm.
RESULTS AND DISCUSSION
Table 1 shows retention times, and the equation of the calibration lines for each water-soluble vitamin standard, with the respective correlation coefficient (R2) values, obtained after the RP-HPLC analysis. The R2is equal to 0.99 for all vitamin standards, indicating the very good linearity of the method.
Table 1. Retention time (RT) and equation of the calibration lines for each hydrosoluble vitamin standard together with the respective R2 values.
| Hydrosoluble Vitamin standards | RT (min) | Equation | R2 |
| Thiamine (vitamin B1) | 24.2-24.6 | y=33.53x-3.8732 | 0.992 |
| Riboflavin (vitamin B2) | 19.4-19.9 | y=121.82x-0.9437 | 0.999 |
| Nicotinic acid | 4.27 | y=15.323-0.3843 | 0.999 |
| Nicotinamide | 5.8-6.0 | y=10.343x+3.4316 | 0.995 |
| Pyridoxine (vitamin B6) | 8.14 | y=11.605x-3.3578 | 0.999 |
| Folic acid | 12.2-13.4 | Y=110.71x-15.488 | 0.999 |
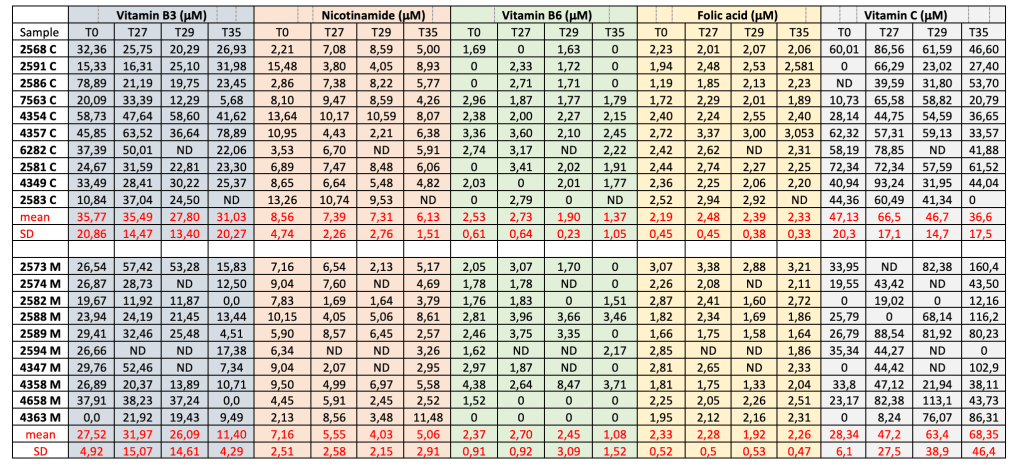
In table 2 the water-soluble vitamins content for each milk control sample and each milk sample obtained from cows fed by microcaps is showed.
Table 2. Water-soluble vitamins content in milk samples from control cows (C) and from cows fed with the microcaps (M), raw data.
Statistical Analysis
Vitamin B1 and B2 were not detected. An analysis of variance was used to determine the significance of differences in values obtained in this study, using general linear model procedures of the statistical package of SAS (2001). Significant differences between means were indicated when P < 0.05.
Table 3. Effects of different rations on milk water-soluble vitamins content (means±S.D.)
| T0 C Group | T0 M Group | T27 C Group | T27 M Group | T29 C Group | T29 M Group | T35 C Group | T35 M group | |
| Vitamin B3(µM) | 35.8±20.9a | 27.5±4.92a | 35.5±14.5a | 32.0±15.0a | 27.8±13.4b | 26.1±14.6b | 31.0±20.3a | 11.4±4.30C |
| Nicotinamide (µM) | 8.60±4.74a | 7.16±2.51a | 7.39±2.26a | 5.55±2.60b | 7.31±2.80a | 4.03±2.15B | 6.13±1.51b | 5.06±2.91B |
| Vitamin B6 (µM) | 2.53±0.61a | 2.37±0.91a | 2.73±0.64a | 2.70±0.92a | 1.90±0.23a | 2.45±0.39a | 1.37±1.05b | 1.08±1.52b |
| Vitamin B9 (µM) | 2.19±0.45a | 2.33±0.52a | 2.48±0.45a | 2.28±0.50a | 2.39±0.38a | 1.92±0.53a | 2.33±0.33a | 2.26±0.47a |
| Vitamin C (mM) | 47.1±20.3a | 28.3±6.1C | 66.5±17.1B | 47.2±27.5a | 46.7±14.7a | 63.4±39.0b | 36.6±17.5C | 68.4±46.4b |
Different letters on the same row show statistical difference: b (P<0.05) B (P<0.01) C (P<0.001)
DISCUSSION
Vitamin B3 content was significantly affected (P<0.001) in the last sample (T35) collected from the treated group M; a significant loss of this vitamin was registered in M group. The decrease of vitamin B3 content started both for C and M groups at the sample collected on day 29 (P<0.05), but the control group C in the sample collected on the last day of treatment (T35) showed a regular content, while in the treated M group this value collapsed.
Nicotinamide content was significantly reduced in M group (P<0.01) both at T29 and T35: in the samples collected on day 35 also C group showed a less significant (P<0.05) reduction.
Vitamin B6 content showed a significant reduction in both control (C) and treated group (M) in the samples collected at the end of the treatment (T35): for this reason, this effect can be mainly attributed to the stage of lactation rather than to the M treatment.
Vitamin B9 content has not been affected by the treatment, no significant differences have been registered.
Vitamin C content showed a very irregular behaviour all over the trial: the initial values were significantly different (P<0.001) among C and M groups. In the samples collected on day 27 vitamin C remained significantly higher (P<0.01) in C group, while in the samples collected on day 29 and on day 35 treated M group was significantly (P<0.01) higher compared to control group C. The large increase in vitamin C content T29 and T35 can be attributed to the effects of the treatment.
FAT-SOLUBLE VITAMINS DETERMINATION
MATERIALS AND METHODS
The method was based on the protocol of Albalá-Hurtado and co-workers with some modifications [2]. Before to perform the analysis, milk was prepared by the following protocol: to 5 ml of milk in a graduated flask, 0.1 g of ascorbic acid was added following by the addition of 10 ml of absolute ethanol and 2 ml of 60% potassium hydroxide solution. The graduated flask was closed hermetically and kept it in the dark, the mixture was incubated at 60 °C for 30 min under shaking, cooled for 5 min in cold water (water and ice) and 5 mL of n-hexane, was added followed by vigorous shaking for one minute. The content was transferred into a 50 mL separatory funnel and the phase is left to separate for 5 minutes; this step was repeated three times. All organic phases (transparent upper part after separation in the funnel are combined. The collected solvent (approximately 15 ml) was evaporated by a speedvac evaporator.
The standard stock solutions of the vitamins: retinol (vitamin A) (500 μg / mL), cholecalciferol (vitamin D3) (100 μg / mL) and α-tocopherol (vitamin E) (500 μg / mL) were prepared by weighing accurately 5, 10 and 50 mg of vitamins A, D3 and E in volumetric flasks of 10, 100 and 100 ml respectively. Sequentially, a volume of 2, 5, and 5 mL of absolute ethanol was added to each flask to aid solvation. Subsequently, each flask was filled to the mark using methanol.
The standard stock solutions were stored at -20 ° C for a period not exceeding one week for vitamins A and D3 and two weeks for vitamin E. All standards were protected from light during storage to minimize degradation.
The chromatographic runs were performed according to Albalá-Hurtado and co-workers [1], using an HPLC Agilent 1260 Infinity LC System (Agilent Technologies), consisting of a 1260 Infinity Quaternary Pump, 1260 Infinity Multisampler, 1260 Infinity Multicolumn Thermostat, and 1260 Infinity Diode Array Detector. Data were acquired by the OpenLab Software (Agilent technologies). The column was a C18 HiQSil HS, 5 m, 4.6 mm i.d, 250 mm (Kya Tech Corporation, Tokyo, Japan). The optimized mobile phase was an isocratic mixture of methanol and water (95: 5, v / v) with a flow rate of 1 mL / min, monitoring at 280 nm (optimal absorbance for the detection of vitamins A, E and D3, simultaneously) and a total analysis time of 15 min.
RESULTS AND DISCUSSION
Table 4 shows retention times, and the equation of the calibration lines for each liposoluble vitamin standard, with the respective correlation coefficient (R2) values, obtained after the RP-HPLC analysis. It should be noted that the R2 is equal to 0.99 for all vitamin standards, indicating the very good linearity of the method.
Table 4. Retention time (RT) and equation of the calibration lines for each liposoluble vitamin standard together with the respective R2 values.
| Fat-soluble Vitamin standards | RT (min) | Equation | R2 |
| Vitamin A | 4.20-4.30 | y = 1812x + 28,015 | 0.98 |
| Vitamin D3 | 7.60-8.10 | y = 1756,2x – 39,996 | 0.99 |
| Vitamin E | 8.40-9.0 | y = 229,45x – 8,0551 | 0.99 |
| Vitamin K1 | 13.4-13.6 | y = 1330,7x – 140,23 | 0.99 |
In table 5 the fat-soluble vitamins content for each control milk sample and each milk sample obtained from cows fed by microcaps is showed.
Table 5. Fat-soluble vitamins content in milk samples from control cows (C) and from cows fed with the microcaps (M), raw data.
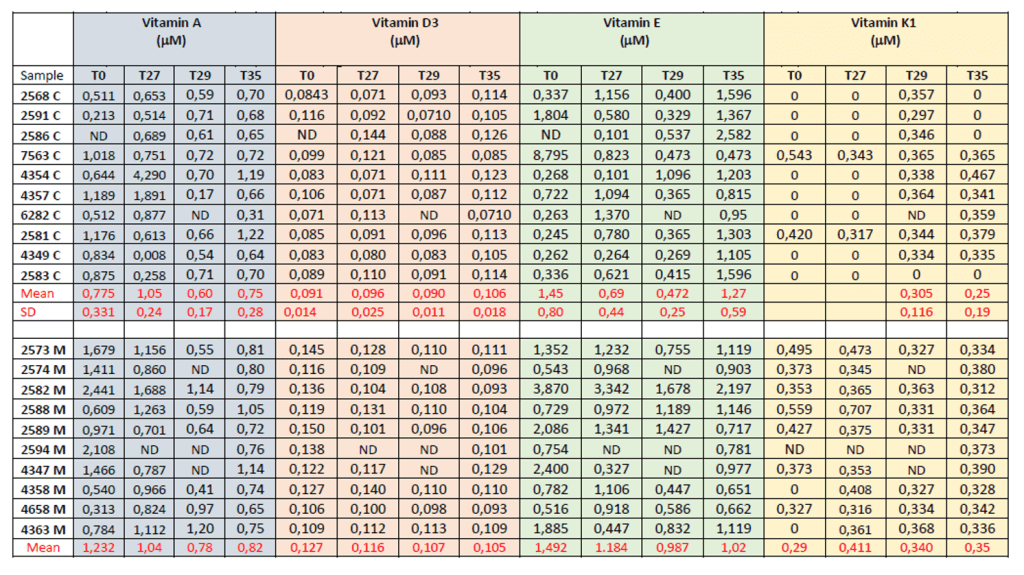
Table 6. Effects of different rations on milk lipo-soluble vitamins content (means±S.D.)
| T0 C Group | T0 M Group | T27 C Group | T27 M Group | T29 C Group | T29 M Group | T35 C Group | T35 M group | |
| Vitamin A (µM) | 0.78±0.33a | 1.23±0.71b | 1.05±0.24b | 1.04±0.31b | 0.60±0.17a | 0.78±0.31a | 0.75±0.28a | 0.82±0.15a |
| Vitamin D3 (µM) | 0.09±0.01 | 0.13±0.01 | 0.09±0.03 | 0.12±0.01 | 0.09±0.01 | 0.11±0.01 | 0.11±0.02 | 0.11±0.01 |
| Vitamin E (µM) | 1.45±0.80a | 1.49±1.08a | 0.69±0.44B | 1.18±0.90b | 0.47±0.25B | 0.99±0.46b | 1.27±0.59a | 1.02±0.48b |
| Vitamin K1 (µM) | n.d. | 0.29±0.21a | n.d. | 0.41±0.12b | 0.31±0.12a | 0.34±0.02a | 0.25±0.19a | 0.35±0.03a |
Different letters on the same row show statistical difference: b (P<0.05) B (P<0.01) C (P<0.001); n.d.: not detected
DISCUSSION
Vitamin A showed a significant increase (P<0.05) in control group (C) in samples collected on day 27. From day 29 and on day 35, too, vitamin A content decreased significantly (P<0.05) in both C and M group. It is hard to understand the possible effects of the treatment on this vitamin content.
Vitamin D3 content has not been affected by the treatment.
Vitamin E content showed a significant decreased in both control (C) and treated (M) group after 27 and 29 days of treatment, with a larger effect in control group (P<0.01) compared to treated group (P<0.05). In the last sample on day 35 vitamin E increased significantly (P<0.05) in control group C, showing a content higher compared to M group.
Vitamin K showed a significant (P<0.05) increase in samples collected on day 27 in treated M group, then in the following samples on day 29 and on day 35 the level of this vitamin remained stable.
GENERAL COMMENTS ON STATISTICAL ANALYSIS
It is hard to evaluate the effects of the treatment on milk vitamins content in a short period lasted 35 days. Vitamin A content in dairy cows milk is normally greatly affected by the diet, but the results obtained in this trial showed similar results in both treated and control groups.
Before writing a final comment about vitamins content in this experiment, it is better waiting for other results about milk chemical composition, and also about derived cheese chemical composition.
REFERENCES
[1] Albalá-Hurtado, S.; Veciana-Nogués, T.; Izquierdo-Pulido, M.; Mariné-Font, A. Determination of water-soluble vitamins in infant milk by high performance liquid chromatography. J. Chromatogr. A1997, 778, 247–253.
[2] Albalá-Hurtado, S.; Rodriguez, S,N., Veciana-Nogués, T. Mariné-Font, A. Determination of vitamins A and E in infant milk formulae by high-performance liquid chromatography. Journal of Chromatography A, 778 (1997) 243-246.
